7.2. Post Processing
MFiX can generate output data in several formats for visualization and analysis.
The command line tool postmfix is distributed with MFiX. In addition, the
MFiX output file format is supported by the open source GUI tools ParaView (version 4.1 or later) and VisIt.
The following table lists the files typically associated with an MFiX simulation.
Filename |
File Type |
Fluid Data |
Particle Data |
Paraview |
Visit |
|---|---|---|---|---|---|
|
MFiX Binary |
Yes |
No |
Yes |
Yes |
|
MFiX Binary |
No |
Yes |
No |
No |
|
VTK |
Yes |
No |
Yes |
No |
|
VTK |
Yes |
No |
Yes |
Yes |
|
VTK |
Yes |
No |
Yes |
No |
|
VTK |
Yes |
No |
Yes |
Yes |
|
VTK |
No |
Yes |
Yes |
No |
|
VTK |
No |
Yes |
Yes |
Yes |
|
VTK |
No |
Yes |
Yes |
No |
|
VTK |
No |
Yes |
Yes |
Yes |
Notes:
pvd files only contain information linking the respective .vtu and .vtp files to time- step information.
<VTK_REGION >_###.vtp files are binary files. The <RUN_NAME >_DES_###.vtp are ASCII files.
7.2.1. Running ParaView
This walk through demonstrates how to use ParaView to visualize the results of the dem/fluid_bed_3d tutorial. It is assumed that the dem/fluid_bed_3d tutorial was successfully run with default settings and that ParaView is installed on your system. First, the tutorial demonstrates how to visualize the fluid field; then, the DEM particles are added using spherical glyphs.
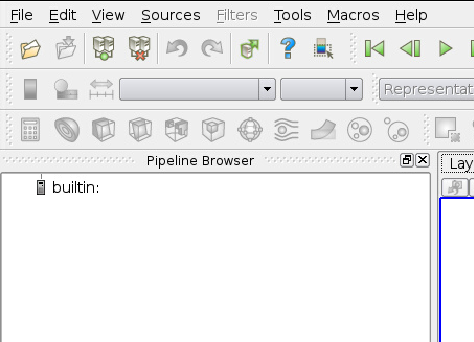
Fig. 7.1 Click on File icon ![]() , or File > Open
, or File > Open
Fluid field results for a standard structured mesh are displayed in ParaView by loading the .RES file. To open the RES file, click on File/Open (Fig. 7.1), and navigate to your run directory.
Select the DES_FB1.RES file (Fig. 7.2).
Do NOT load the DES restart file (DES_FB1_DES.RES). This binary file is not
supported by any visualization software. It only contains restart data and will
likely cause ParaView to crash if loaded.
Once the file is loaded, you need to click on the green “Apply” icon ![]() to load
all of the variables.
to load
all of the variables.
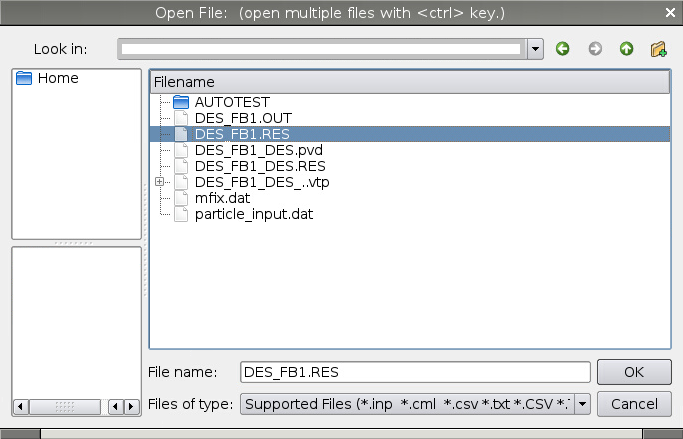
Fig. 7.2 Load DES_FB1.RES (do NOT load DES_FB1_DES.RES)
Newer versions of ParaView require that you select the appropriate reader. Choose to open the data with “MFiX Unstructured Grid Files”. (Fig. 7.3)
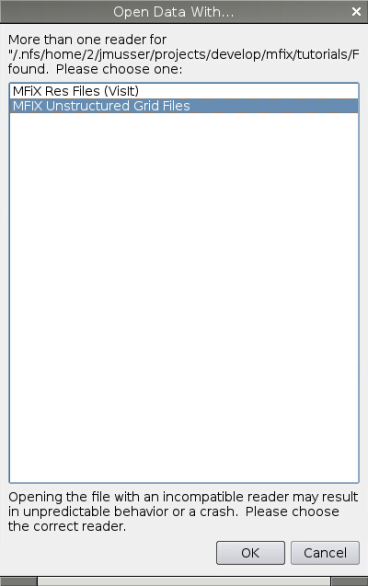
Fig. 7.3 Select “MFiX Unstructured Grid Files”
ParaView typically displays the gas phase volume fraction once the data is
loaded. It may be necessary to rescale the data range as the initial range may
only be suitable for displaying the initial conditions. This can be done by
clicking the ![]() icon.
icon.
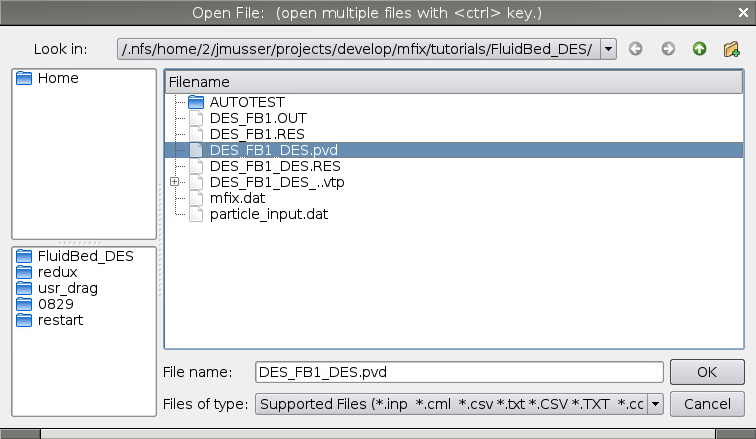
Fig. 7.4 Open DES_FB1_DES.pvd
DEM and PIC particle simulation data is loaded into ParaView by opening the
.pvd file. (Fig. 7.4)
Again, click on the green “Apply” icon ![]() to load all of the variables.
(Fig. 7.5)
to load all of the variables.
(Fig. 7.5)
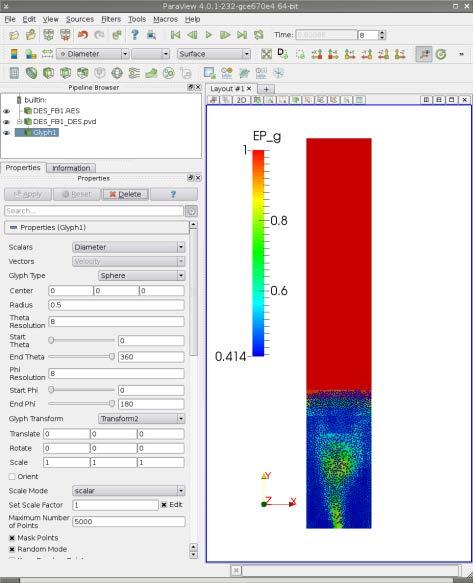
Fig. 7.5 Load all variables
Particles are shown by applying a glyph to the dataset. To apply a glyph filter, either:
Filters > Alphabetical > Glyph
or click the
icon.
Commonly, particle data is represented using:
Sphere glyph type and
Scalar scale mode with a scale factor of one.
Note that these screenshots may appear differently depending on your version of ParaView.
7.2.2. Building postmfix
The postmfix command is used for reading the binary MFiX .SPx output
files and outputting data to text files. The following walk through demonstrates
how to run postmfix on the results from the dem/fluid_bed_3d tutorial with the
default settings.
The postmfix executable is built by running build_mfixsolver with the
argument postmfix:
From the Anaconda package:
> build_mfixsolver postmfix
From source:
> cd mfix-21.1.4
> mkdir build
> cd build/
> cmake .. -DENABLE_POSTMFIX=1
> make postmfix
7.2.3. Running postmfix
After building, run the executable and enter the run name:
> ./postmfix
Enter the RUN_NAME to post_process > DES_FB1 ? DES_FB1<Enter>
A simple menu of options is presented. Type 1 to examine/print data and press Enter.
*************************************************
0 - Exit POST_MFIX
1 - Examine/print data
2 - Write .RES from data in .SPx files
3 - Write .RES for a new grid, using old data
4 - Calculate miscellaneous quantities
5 - Print out variables
6 - Call user defined subroutine USR_POST
7 - Write a new SPx file with selected records
8 - Write new SPx files with time averaged data
9 - Perform ORNL calculations
10 - run scavenger code
*********************************** **************
Enter menu selection > 1

Interactive data retrieval program. Type ? any time for help,
or press RETURN to select default values shown in parenthesis.
Type F to use the default data precision and press Enter.
Write output using user - supplied precision? (T/F) F ? F<Enter>
Enter a time range for data extraction and analysis. The default simulation has a simulation length of one second, so enter a range from 0.1 seconds to 0.9 seconds. The next prompt asks if the data should be time averaged. Press Enter to skip the averaging.
Time: (0.000, 0.000) > 0.1, 0.9
Time average ? (N) > ? < Enter >
Enter the variable of interest. The default is the gas phase volume fraction, EP_G. A complete list of possible entries is given by typing ? and Enter. Press Enter to select the gas phase volume fraction.
Variable: (EP_g) > ? < Enter >
Next, enter the spatial range to extract the data. This requires an understanding of the I/J/K values for your simulation. Basic geometric information for the simulation is provided in the .OUT file. For this example, we will take a vertical slice from the approximate center of the 2D domain.
I range: (1, 1) > 8 , 8 ? 8,8< Enter >
J range: (1, 1) >2,40 ? 2,40< Enter >
Average or sum over J? (N) > ? < Enter >
K range: (1, 1) > ? < Enter >
Specify where to output the data. Press Enter to select the default *, which will send
the data to the terminal. Alternatively, specify a file name to save the data in a data file.
File: (*) > ? <Enter> prints to screen
(filename<Enter> saves to filename)
X = 6.5000
Z = - 0.20000
Time = 0.10075
Y      EP_g
1.0000 0.43971
3.0000 0.45994
....etc....
After the output is generated, you will be presented with a prompt to continue data extraction or analysis. Type q and Enter to return to the main menu. From the main menu, type 0 and Enter to exit .
Time: (1.000, 1.000) > q ? q< Enter > to quit
< main menu is displayed again >
Enter menu selection > 0 ? 0< Enter > to exit