Validation
Single Particle Bounce
For a very simple test case, a series of synthetic images were constructed of a single particle bouncing. The X velocity is fixed at \(5 pixels/frame\) and the Y velocity is initially set at \(10 pixels/frame\). An acceleration of \(4 pixels/frame^2\) is applied in the Y direction. When the particle collides with the walls, 85% of the Y velocity is retained.
This set of images was tracked using the Poly Projection with the default settings and no velocity filters. The particle center was found by using the Label method.

Almost all of the particle positions are found and included in tracks except for some of the positions at the wall as well as at the top of the arcs. At the walls, the true particle centers are not found because the particles are being clipped. At the top of the arcs, the default search radius is to small.
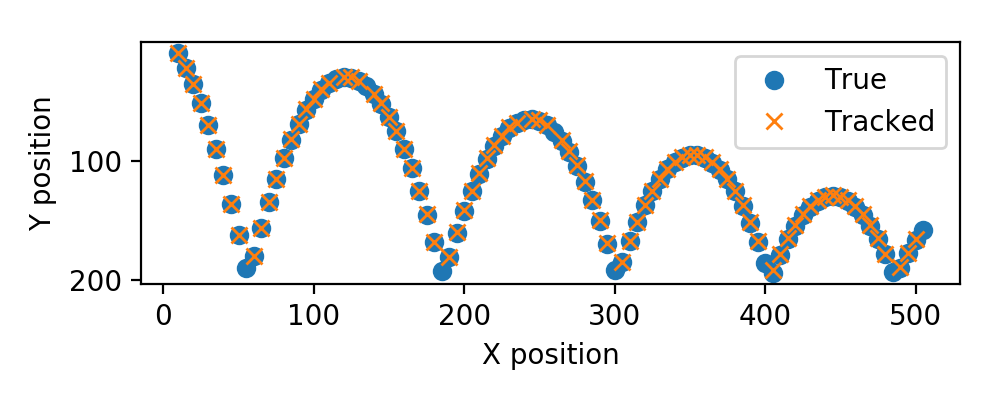
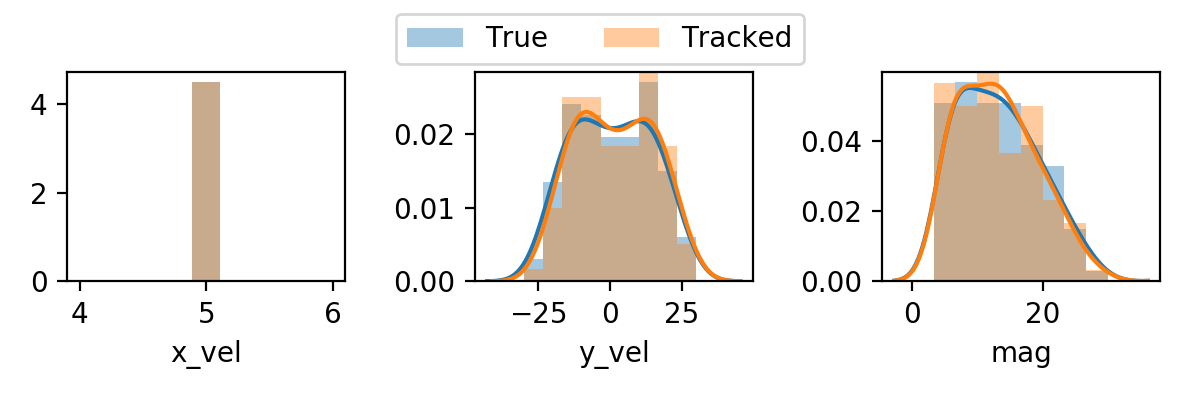
Overall, the True and Tracked velocities compare very well. However there are some discrepancies due to the missed particle centers.
SSCP July 17, 2012, 4Umf Run 1
The small scale challenge problem (SSCP) 4Umf Run 1 video (resolution of 1280x800, 21,090 frames) was processed on a Dell Precision 9710 with an Intel Xeon E5-2667 v4 running at 3.2GHz with 32 cores and 188.7GB of RAM, running CentOS7. Using 15 workers and multiprocessing, the video was processed in 33 minutes. 42,001,791 individual velocity measurements were recorded.
Comparing to the previous work performed by Gopalan et al. as part of the SSCP [GSP+16]:
| Value | Tracker | Gopalan |
|---|---|---|
| Velocity measurements | 41,356,169 | 34,479,966 |
| Mean X Velocity | -0.0042 | -0.0060 |
| Mean Y Velocity | -0.1299 | -0.1457 |
| Mean Magnitude | 0.4589 | 0.4704 |
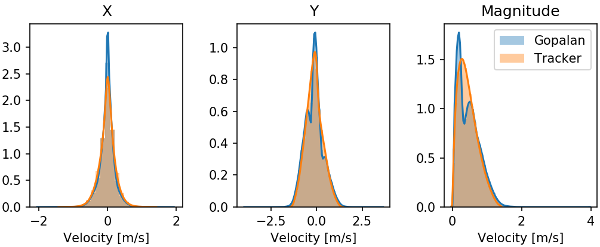
Comparing the velocity distributions of the X velocity, Y velocity, and magnitude between the two techniques shows good agreement in the X velocity. However, the results of Gopalan show a bi-model distribution in the Y velocity and consequently a bi-model distribution in the magnitude.
Comparing the centers between to two codes for the first 20 frames shows that both codes track the same particles. Tracker does seem to find more particles, especially ones that are further back in the bed.
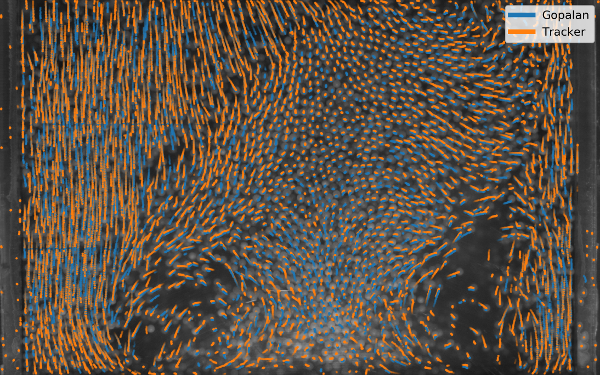
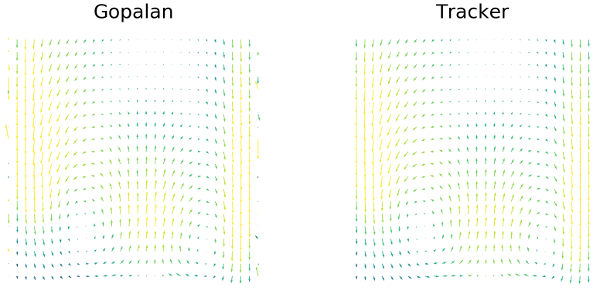
Comparing the binned and averaged velocities, both codes show the same structure with the two vortices.
| [GSP+16] | Balaji Gopalan, Mehrdad Shahnam, Rupen Panday, Jonathan Tucker, Frank Shaffer, Lawrence Shadle, Joseph Mei, William Rogers, Chris Guenther, and Madhava Syamlal. Measurements of pressure drop and particle velocity in a pseudo 2-d rectangular bed with geldart group d particles. Powder Technology, 291:299 – 310, 2016. URL: http://www.sciencedirect.com/science/article/pii/S0032591015302503, doi:https://doi.org/10.1016/j.powtec.2015.12.040. |