First Tutorial
In this first nodeworks tutorial, we’ll test your installation of nodeworks by making the simple sine and cosine wave plot. To begin, launch a new session of nodeworks from a terminal with:
$ nodeworks
Step 1: Add the nodes
First we will add four nodes: a Range node, two Trig nodes and a Plot node. To add a node to the sheet, right click on the Nodeworks canvas and a context menu will pop up. Navigate to Add Node at the bottom, then to numpy and then to click on Range as shown below.
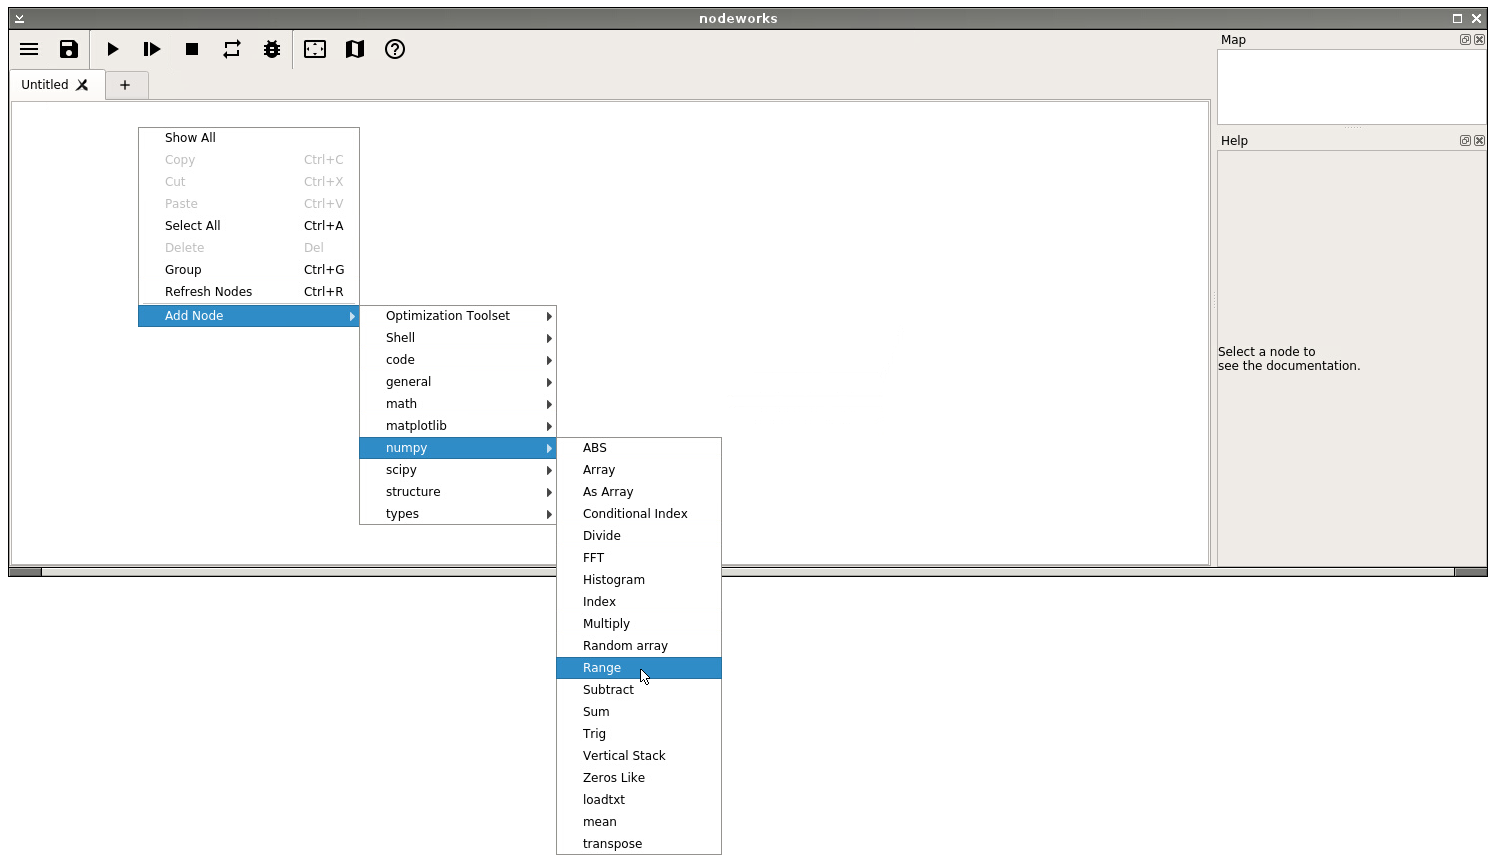
Note
You can delete a node by highlighting it (either left click on it or drag a box surrounding it) and pressing delete on the keyboard. Highlighted nodes can also be moved around the sheet by dragging while holding left click. The sheet itself can be panned over by holding and dragging the wheel button. A map of the sheet is shown in the upper left-hand corner.
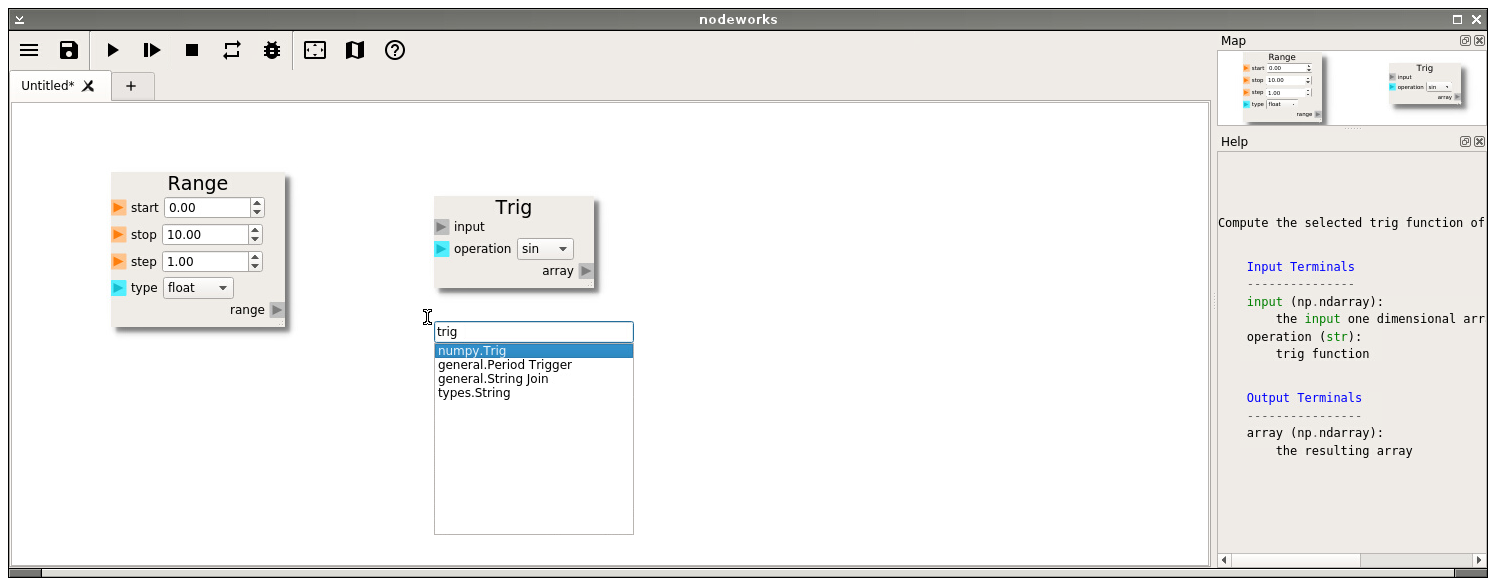
Change the range step size to 0.1 for a smoother curve. The Trig node is also located in the numpy node group and can be added in the same way or, since we know the name of the node we want to add, you can shortcut to the node library short by left clicking on the screen where you want to add the node and typing the node name directly on the keyboard. A shortened dropdown list will appear with nodes matching the search, as shown below. Set the operation of the second Trig node to cos. Finally, add the Plot node which is located in the matplotlib group.
Note
Ctrl+c and Ctrl+v shortcut keys could also be used to copy and paste a second Trig node.
Step 2: Connect the nodes
The four nodes need to be connected to form a process or workflow. Left click on the output terminal of the Range node, range. Drag the connection over to the input terminal of either of the Trig nodes. Make a similar connection to the other Trig node. Connect both of the Trig array output terminals to the y input terminal of the Plot node. The final connection is made from the range terminal to the x input terminal of the Plot node.

Step 3: Run the sheet
Run the sheet by pressing the Run button on the top toolbar (third from left). The sheet should look similar to the above figure. The sheet can be saved by pressing the Save button (second toolbar button on the left) which creates a node chart (*.nc) file that can be reopened in the Main Menu (leftmost toolbar button).
This simple tutorial only scratches surface of the nearly unlimited possibilities that Nodeworks offers. If you are interested in learning more advanced features of Nodeworks or even developing your own nodes or interfaces with other programs, please see our Developers section. If you are most interested in the capability of Nodeworks to interface with the MFiX GUI, please see the MFiX Interface section. In addition, we release collections of nodes or specialized nodes called Toolsets which contain more advanced examples on their use and functionality. Please direct any questions or feedback to the mailing list.
Thank you for your interest in Nodeworks. Happy Noding!