Forward Propagation
The Forward Propagation node allows for the exploration of aleatory
variability and epistemic uncertainty of the model. Following the UQ methodology
of Roy and Oberkampf [Roy2011], aleatory and epistemic uncertainties are segregated and
aleatory variables are re-sampled for every epistemic sample. In the hybrid case,
i.e., input variables are both aleatory and epistemic, the output model
variability is expressed as a p-box or probability box. In the degenerate cases
that only aleatory or epistemic variables are considered, the output will default
to either a CDF or range (bounds).
Options
global settings
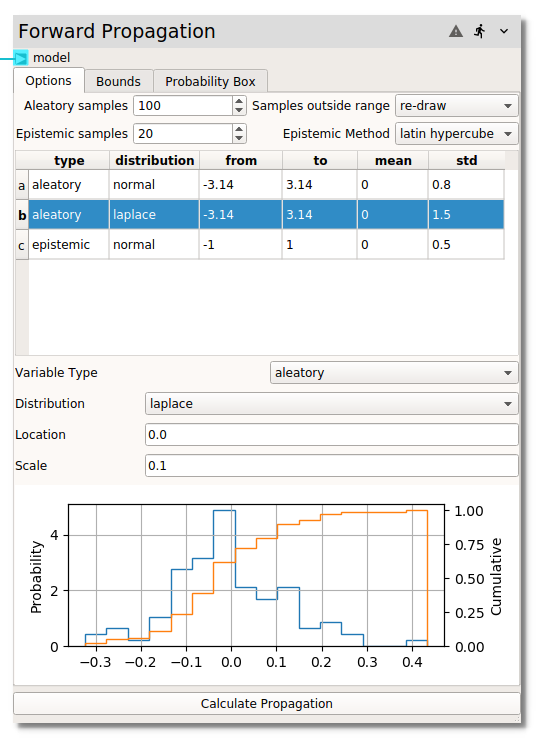
Above the variable table are settings which are applied to all variables, most
importantly the number of Aleatory samples and the number of Epistemic samples.
When sampling aleatory variables from a distribution, especially when the number
of samples becomes large, it is possible that input values will be drawn outside
of the surrogate models’ support regions, i.e., values smaller or larger than the
bounds used in the sampling design used for the construction of the surrogate.
Three options are available for Samples outside range is detected:
re-drawthe full number of aleatory samples (for the given epistemic sample if considered)
clipthe sample to the extreme of the input variable range
usethe sample, even when it exceeds the input variable range
Currently, a single sampling method is applied to all epistemic variables. The
Epistemic Method dropdown provides all of the DOE Design
options except CCD. The default LHS is strongly recommended for forward propagation
sampling.
variable specific
After selecting a variable in the table, its specific options can be set below the
table. First, the Variable Type is set to aleatory or epistemic. Aleatory variables
need to have a specified Distribution :
uniform
normal
lognormal
gumbel
laplace
logistic
wald
Alternatively, a user Distribution can be input in csv format. For epistemic
variables, the only required input are the From and To bounds for sampling.
Below the variable option specification area, an example distribution for the
specified number of samples is provided. These samples are not directly used in
the forward propagation step, but provide the user an idea of the spread which
will be observed during sampling. If the range of the example sample significantly
exceeds the limits of the input variables, this may result in:
a quasi-infinite loop if
Samples outside rangeare re-drawna non-conservative estimation if
Samples outside rangeare clippeda poor prediction if
Samples outside rangeare used as-is
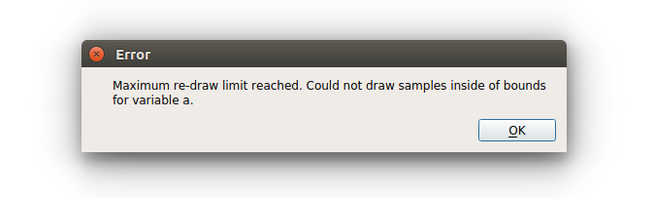
When variable specification is complete, the Calculate Propagation button
at the bottom of the node (present in all tabs) is pressed to forward propagate
the input uncertainties through the surrogate model to obtain the output
uncertainties. If the propagation is successful, the output uncertainty will be
displayed in the Probability Box tab. Otherwise, an error may be encountered
if too many Samples outside range are encountered.
Bounds
When analyzing the (forwrd) propagated uncertainties, typical decision making questions are usually in the form of either:
What is probability that the response will be above/below a certain response value?
What is the response for a given probability, i.e., confidence level?
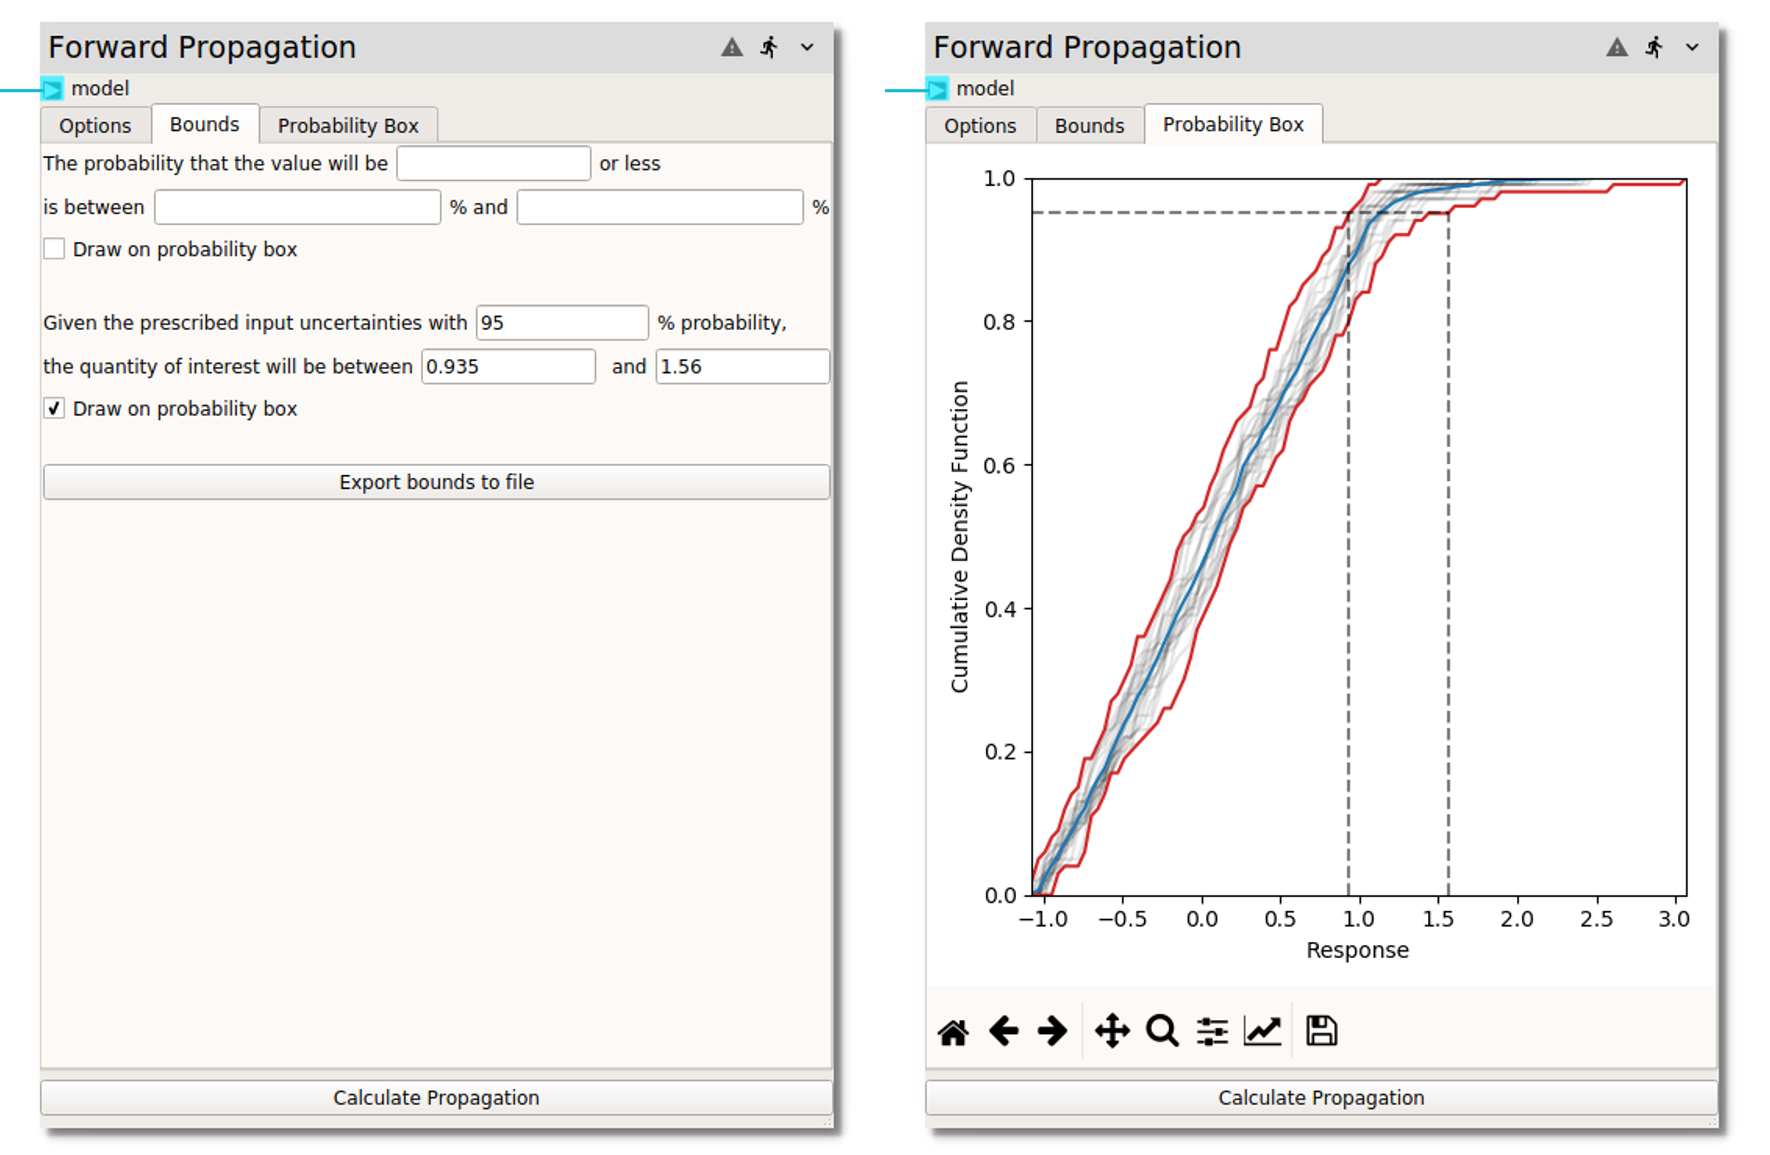
Either or both of these analyses can be performed on the p-box in the Bounds tab.
In the former case, the desired response is entered in
The probability that the value will be or less box. For hybrid input
uncertainties, a probability range will be returned. In the latter case, as shown in the
image below, the Given the prescribed input uncertainties with is set to
95 % probability. The example in the figure contains both types of uncertainties,
therefore the response is returned as a range:
the quantity of interest will be between 0.935 and 1.56. The response range at the
95% probability level is plotted on the p-box when the
Draw on probability box is checked.
The Export bounds to file button allows the extremes of the p-box to be
exported to a csv file.
Probability Box
The Probability Box tab displays the surrogate model propagated output uncertainty
from the input variable uncertainties characterized in the Options tab. When both
aleatory and epistemic uncertainties are present, each vector of aleatory uncertainties
for a given epistemic sample is displayed as a cumulative distribution function (CDF)
plotted as a thin black line. If the number of epistemic samples is high, this may simply
appear as a dark region. The p-box is defined by the minimum and maximum response at each
aleatory CDF level. The p-box bounds are highlighted in red and can be exported to a
csv in the Bounds tab. The blue line represents a median distribution, i.e., if
the hybrid aleatory-epistemic uncertainty segregation is removed and all data are
collapsed into a single CDF. If response or probability bounds are set and displayed in
the Bounds tab, they will appear on the p-box plot as dashed black lines.
References:
- Roy2011
C.J. Roy and W.L. Oberkampf, A comprehensive framework for verification, validation, and uncertainty quantification in scientific computing, Computer Methods in Applied Mechanics and Engineering, Volume 200, Issues 25–28, 2011, Pages 2131-2144, ISSN 0045-7825, https://doi.org/10.1016/j.cma.2011.03.016