3.4. Three Dimensional Single phase flow over a sphere
This tutorial shows how to create a three dimensional single phase flow over a sphere.
Property |
Value |
|---|---|
geometry |
60 cm 20 cm x 20 cm |
mesh |
30 x 10 x 10 |
gas velocity |
1 m/s |
temperature |
298 K |
pressure |
101325 Pa |
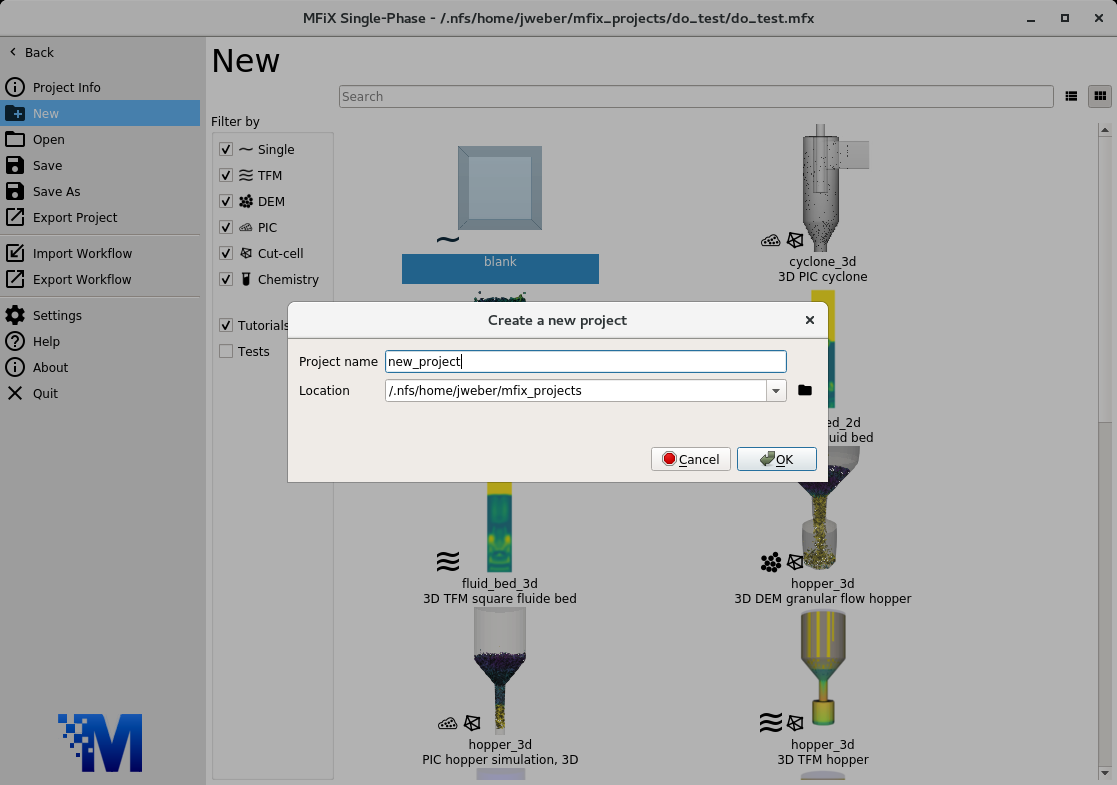
3.4.1. Create a new project
On the main menu, select
New projectCreate a new project by double-clicking on “Blank” template.
Enter a project name and browse to a location for the new project.
When prompted to enable SMS workflow, answer No, we will use the standard workflow for this tutorial.
Note
A new project directory will be created in the location directory, with the name being the project name.
3.4.2. Select model parameters
On the Model pane:
Enter a descriptive text in the
DescriptionfieldSelect “Single Phase” in the
Solverdrop-down menu.

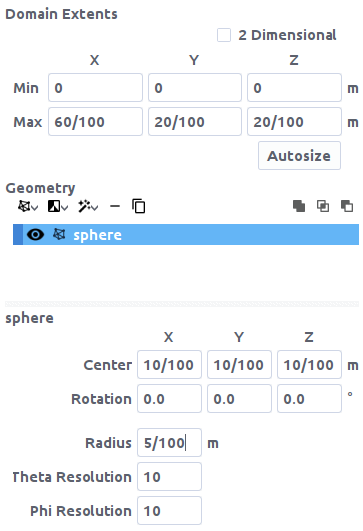
3.4.3. Enter the geometry
On the Geometry pane enter the domain extents:
60/100meters for the maximum x value20/100meters for the maximum y value20/100meters for the maximum z value
Next, add a sphere by clicking the  button -> primitives -> sphere.
This adds a sphere constructed of triangles (STL) to the project.
button -> primitives -> sphere.
This adds a sphere constructed of triangles (STL) to the project.

Change the center position and radius of the sphere so that it is located in the domain by entering the following:
10/100for the center X position10/100for the center Y position10/100for the center Z position
Change the radius of the sphere by entering:
5/100for the radius.
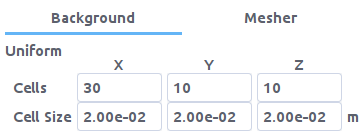
3.4.4. Enter the mesh
On the Mesh pane, Background sub-pane:
Enter
30for the x cell valueEnter
10for the y cell valueEnter
10for the z cell value
3.4.5. Create regions for initial and boundary condition specification
Select the Regions pane. By default, a region that covers the
entire domain is already defined.
A region for the sphere is needed to apply a wall boundary condition to:
Click the
 (all) button to create a region that encompasses the entire
domain
(all) button to create a region that encompasses the entire
domainchange the name of the region to a descriptive
namesuch as “sphere”Check the
Select facets (STL)check-box to turn the region into a STL region. The facets of the sphere should now be selected.

Create a region to apply a mass inflow boundary condition to:
Click the

Enter a name for the region in the
Namefield (“inlet”)
Create a region to apply a pressure outlet boundary condition to:
Click the

Enter a name for the region in the
Namefield (“outlet”)
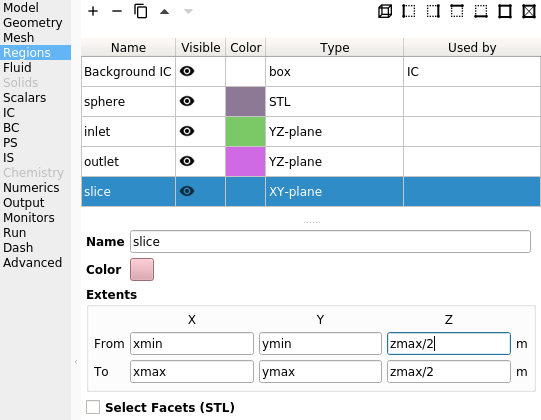
Finally, create a slice through the center to use as a vtk output region:
Click the

Enter a name for the region in the
Namefield (“slice”)Enter
zmax/2in both theFrom ZandTo Zfields to move the region to the center of the domain
3.4.6. Create Initial Conditions
Select the
Initial conditionspaneSelect the already populated “Background IC” from the region list. This will initialize the entire flow field with air.
Enter
101325Pa in thePressure (optional)field
3.4.7. Create Boundary Conditions
Select the Boundary conditions pane and create a wall boundary condition for
the sphere by:
clicking the
 button
On the
Select regiondialog, select “No Slip Wall” from theBoundary typecombo-boxSelect the “sphere” region and click
OK
Add a mass inflow boundary condition by:
clicking the
buttonOn the
Select regiondialog, select “Mass Inflow” from theBoundary typecombo-boxSelect the “inlet” region and click
OKOn the “Fluid” sub-pane, enter a velocity in the
X-axial velocityfield of1.0m/s
Finally, create a pressure outlet boundary condition by:
clicking the
buttonOn the
Select regiondialog, select “Pressure outflow” from theBoundary typecombo-boxSelect the “outlet” region and click
OK
Note
The default pressure is already set to 101325 Pa, no changes need to be made to the outlet boundary condition.
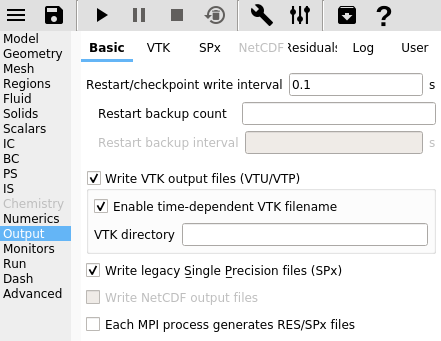
3.4.8. Select output options
On the Output pane:
On the
Basicsub-pane, check theWrite VTK output files (VTU/VTP)checkbox
Select the
VTKsub-paneCreate a new output by clicking the
buttonSelect the “slice” region from the list to save cell data at a slice through the domain
Click
OKto create the outputChange the
Write intervalto “0.01” secondsSelect the
Pressure,Velocity vector,Velocity x-component,Velocity y-component, andVelocity z-componentcheck-boxes on theFluidsub-sub-pane
3.4.9. Change run parameters
On the Run pane:
Change
Stop time stepto2.0secondsChange
Time stepto1e-2secondsChange
Maximum time stepto1e-2seconds
3.4.10. Run the project
Save project by clicking the
 button
Run the project by clicking the
 button
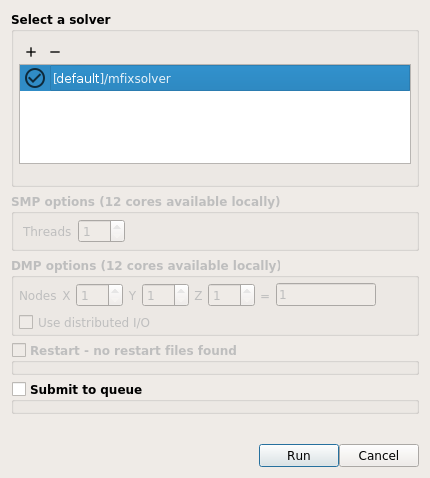
On the
Run Solverdialog, select the executableClick the
Runbutton to actually start the simulation
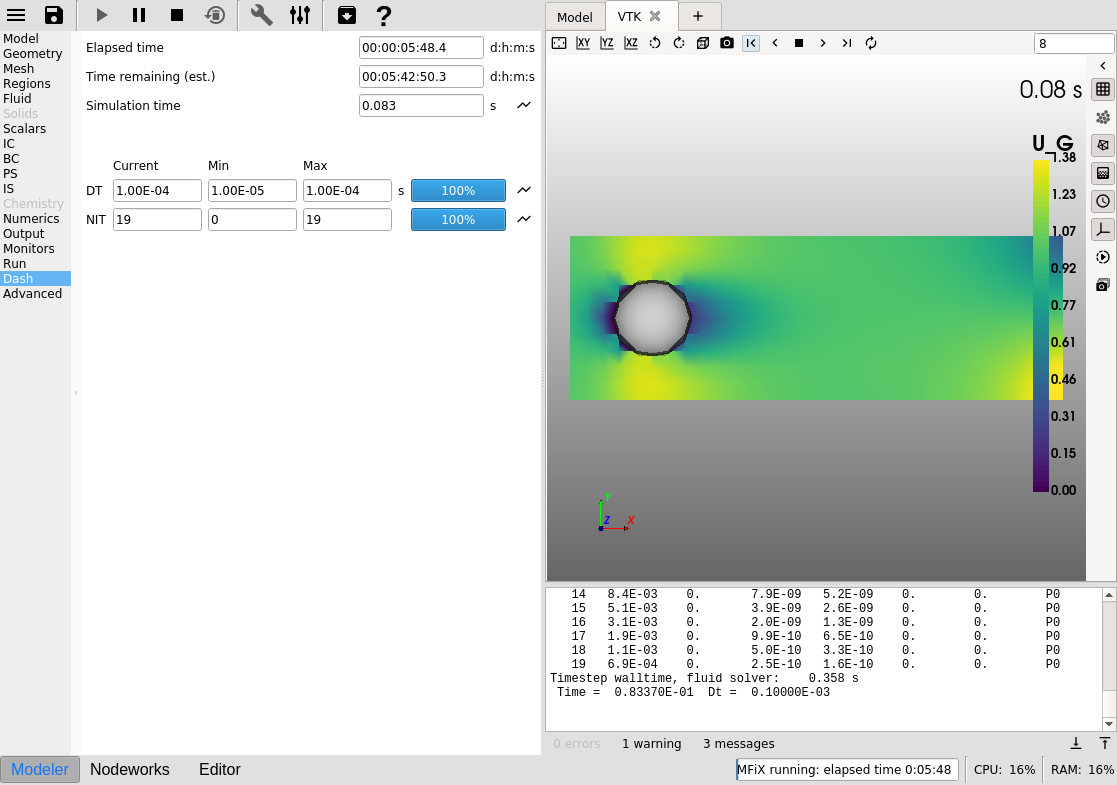
3.4.11. View results
Results can be viewed, and plotted, while the simulation is running.
Create a new visualization tab by pressing the
next to the Model tabSelect an item to view, such as plotting the time step (dt) or click the
3D viewbutton to view the vtk output files.On the
VTKresults tab, the visibility and representation of the*.vtkfiles can be controlled with the menu on the side.