Sensitivity Analysis
Sensitivity Analysis (SA) provides a systematic approach to identify how the variability in the computational model output is associated with the model input parameters. Furthermore, sensitivity analysis is used to quantitatively assesses which input parameters have the most pronounced impact on the model output, specifically on the quantities of interest (QoI), alternatively referred to as system response quantities (SRQs).
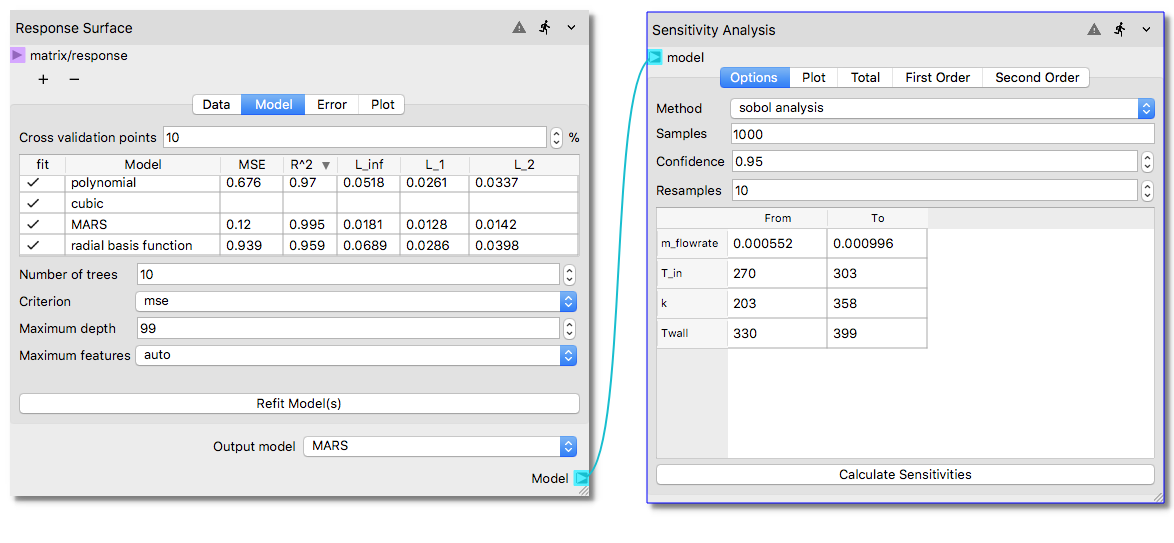
After an adequately representative surrogate model is constructed in the Response Surface node,
the output can be connected to Sensitivity Analysis node as shown in the example workflow below.
Hence, a surrogate model is a pre-requisite for the Sensitivity Analysis node execution.
The Sensitivity Analysis node consists of several tabs which enable the user to select
the sensitivity analysis method and associated settings, visualize the results and collect
collect the quantitative results. The function of each tab is described below.
Options
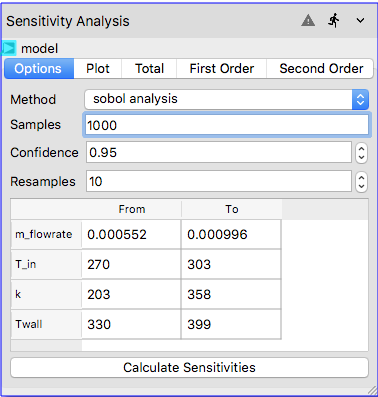
The Options tab enables the user to select the sensitivity analysis method.
Current sensitivity analysis options have been adapted from [SALib] and include:
Sobol Sensitivity Analysis [Sobol2001]
Method of Morris [Morris1991]
Fourier Amplitude Sensitivity Test (FAST) [Cukier1973]
Delta Moment-Independent Measure [Borgonovo2007]
Upon selection of a sensitivity analysis method the user can set a number of parameters for
that method, e.g., sample size and confidence interval for Sobol Sensitivity Analysis. After required
parameters are set, the analysis is launched by clicking the Calculate Sensitivities
button at the bottom of the node. Details of the available settings to the user for each
supported sensitivity method is provided in SMA Theory Guide.
After the execution of the sensitivity analysis through Calculate Sensitivities button,
the lower and upper bounds of the input parameters are displayed in tabulated format in the same tab
which will be the first indication for execution of the node.
Plot
The results of the sensitivity analysis performed can be visualized through bar plots as shown in Plot tab.
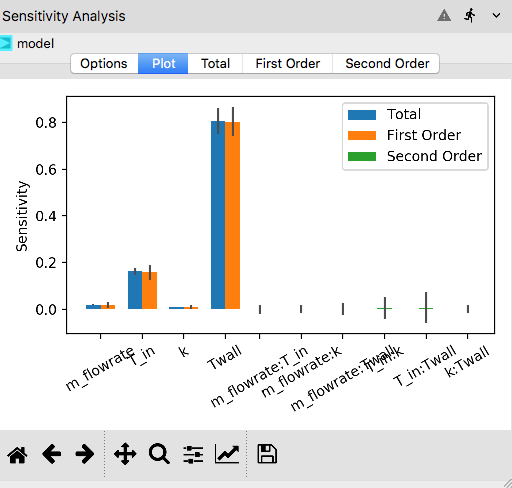
Sensitivity indices calculated for the quantity of interest are shown in the y-axis. All input variables considered for the analysis are shown in x-axis. Bar plots show first order indices for main effects (in orange color), second order indices for interaction effects (in green color), and total indices to take account both (in blue color).
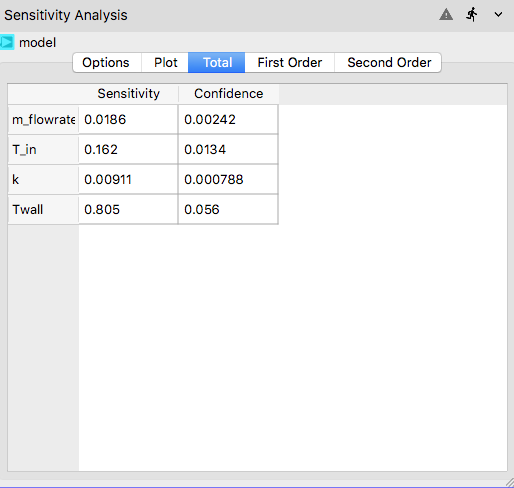
Total
The Total tab shows the results of the total sensitivity indices in a tabular form with confidence intervals shown in the second column. The total sensitivity indices include both first- and second-order indices and range from 0 to 1. Higher sensitivity index in the first column implies a pronounced effect of that input parameter on the output QoI.
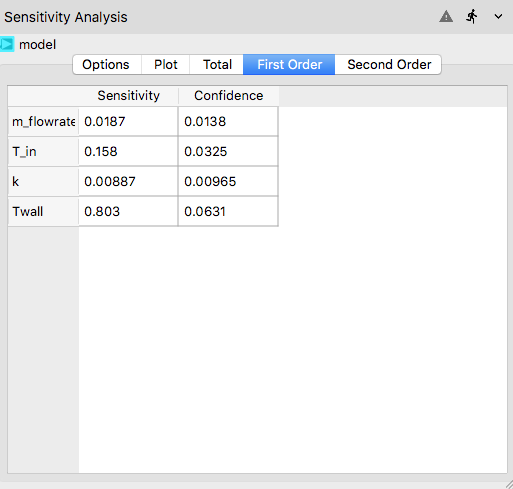
First Order
The First Order tab shows the first-order sensitivity indices in a tabulated format.
First order indices show the standalone effects of the input parameters on the QoI.
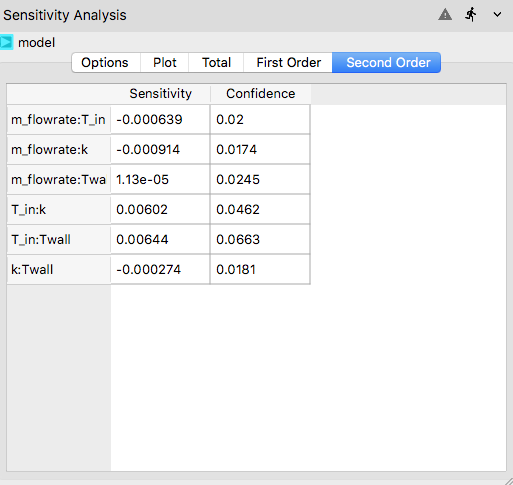
Second Order
The Second Order tab shows the second-order sensitivity indices in a tabulated format.
Second-order indices typically show interaction effects between two input parameters on
the QoI.
References:
- SALib
Sensitivity Analysis Library in Python https://salib.readthedocs.io/en/latest/
- Sobol2001
I.M Sobol′, Global sensitivity indices for nonlinear mathematical models and their Monte Carlo estimates, Mathematics and Computers in Simulation, Volume 55, Issues 1–3, 2001, Pages 271-280, ISSN 0378-4754, https://doi.org/10.1016/S0378-4754(00)00270-6.
- Morris1991
Morris, Max D. Factorial sampling plans for preliminary computational experiments. Technometrics 33.2 (1991): 161-174. https://www.tandfonline.com/doi/abs/10.1080/00401706.1991.10484804
- Cukier1973
Cukier, R. I., et al. Study of the sensitivity of coupled reaction systems to uncertainties in rate coefficients. I Theory. The Journal of chemical physics 59.8 (1973): 3873-3878.
- Borgonovo2007
Borgonovo, Emanuele. A new uncertainty importance measure. Reliability Engineering & System Safety 92.6 (2007): 771-784. https://www.sciencedirect.com/science/article/pii/S0951832006000883