Single Bubble Injection
Another variation on bubbling typically observed in bubbling fluidized beds is the detailed single-bubble study of Boyce and coworkers [BPLPM19]. In the experiment, a cylinderical bed is brought to incipient fluidization (just under minimum fluidization) by a uniform distributor. Then, an additional volume of gas is abruptly injected from a nozzle located in the center of the bed causing a single bubble to form and rise through the bed. Measurement of the evolution of the bubble formation, rise and is captured with high-speed, high-resolution magnetic resonance imaging (MRI) in a 10 mm thick slice through the center of the bed. Two particle types are studied experimentally, only the larger of which is currently used for qualitative benchmarking.
The experimental test section is a cylinderical bed 190 mm in diameter and 300 mm tall. The system is modeled in a domain of size 192 mm square by 384 mm tall with a cylinderical EB geometry centered at \((x,z) = (96, 96)\) mm. The modeled bed height is larger than the experimentso that it can be resolved by a uniform uniform CFD grid of power 2. Specifically, the applied grid is \(32 \times 64 \times 32\), such that \(dx^* \approx 2.0\). \(N_p = 260\)-thousand particles make up a bed of approximately \(h_{bed} = 200\) static bed height. The particles are of diameter \(d_p = 2.93\) mm and density \(\rho_p = 1040\) kg/m3 , respectively. Mass inlet and pressure outlet boundary conditions are specified at the bottom and top of the domain, respectively. The nozzle is modeled with a secondary mass inlet covering the center (in x,z) four CFD cells. We note that, as modeled, the area of the injector is roughly three times that of the experimental nozzle, a tube of \(7.95\) mm diameter. The injection times are adjusted slightly to \(\delta t_{inj} = 154.2\), \(101.7\), \(66.7\), \(51.4\), and \(25.0\) ms so that a uniform jet velocity of \(50\) m/s can be applied in all cases.
A separate defluidization simulation was first carried out first to determine
\(U_{mf} \approx 0.66\) m/s using the WenYu [WY66] drag law, slightly
below the experimentally measured value of \(U_{mf} = 0.7\) m/s. The bed
was prepared with two initialization simulations. First, the particle initial
condition is fluidized above \(U_{mf}\) at \(0.8\) m/s for one second
using both the uniform distributor and jet sections. Then, the jet section is
shut off (velocity in BC set to zero) and the flow in the uniform distributor
section is reduced to incipient fluidization at \(0.66\) m/s for an
additional two seconds. Then, beginning at \(t = 3\) s, the jet region is
set to \(50\) m/s for a specified injection duration given previously.
The jet is switched on and off with a step change in usr1.f90.
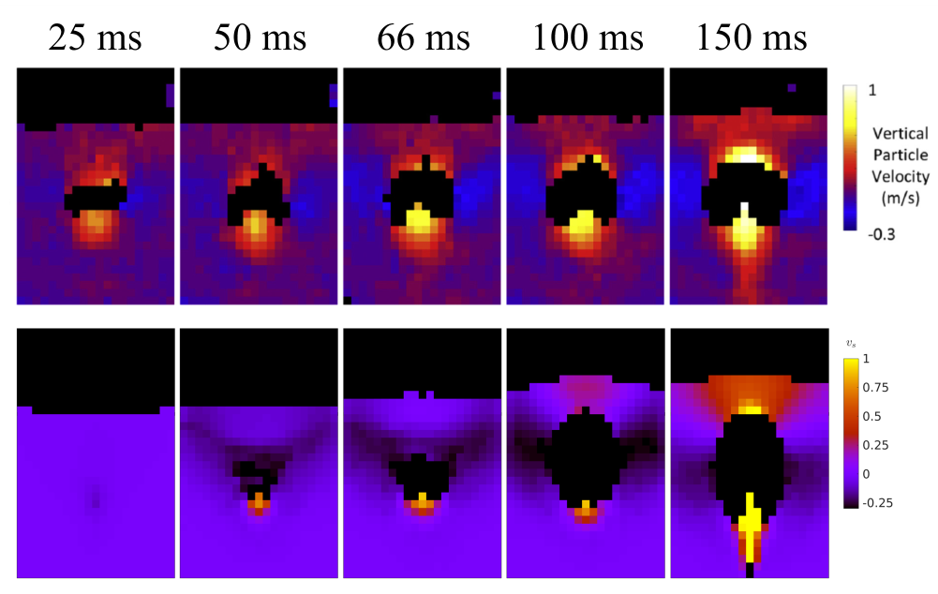
Fig. 44 Comparison of experiment and MFIX-Exa simulaton for single bubbles injected into incipiently fluidized beds for increasing (left to right) injection times.
The figure above provides a comparison between MFIX-Exa 19.08 simulation results and the experimental measurements. In both cases, the particle data has been averaged onto a \(10\) mm thick grid of \(21 \times 32\) For the longer injection times, \(\delta t_{inj} \approx 100\) and \(150\) ms, the simulated bubbles are larger and more elongated than observed experimentally. However, this trend is not universal, at shorter injection times, the bubble is too small and actually collapses before erupting at the surface. Above, the bubble produced from a \(50\) ms injection is currently in the process of collapsing. Another interesting feature (perhaps most apparent at \(66\) ms), is the V-shaped region of particle down flow centered around the bubble centeroid, which appears to be captured rather well by the simulation.