General Optimizer
The General Optimizer is used to find the minimum, maximum, or root of the
model. This can be used to find the optimal solution (sample) of the quantity of
interest.
Warning
Using a black-box approach to optimization does not guarantee that the global minimum, maximum, or root has been found. To overcome this, see Attempts
Minimize and Maximize
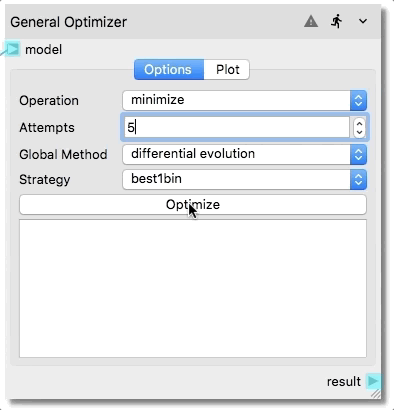
To find the maximum or minimum of the model, select the operation from the
Operation combo-box. Maximization is treated exactly like minimization
except the model is multiplied by a -1.
There are two global methods and 8 local methods implemented in scipy.optimize that can be used. Depending on the method selected, other options maybe be exposed.
Global methods:
Local methods (select local in the Method combo-box):
Root
To find the root of the model, select the find value (root) from the
Operation combo-box. The method can be selected using the Method
combo-box. The available root finding methods are:
Enter the value to find in the Value line-edit.
Attempts
As a tool to overcome the issue of the black-box approach to optimization not
guaranteeing that the global minimum, maximum, or root has been found, the
operation can be run multiple times with a random initial condition. The number
of attempts can be entered in the Attempts spin-box.
numpy.random.random
is used to pick the random initial condition within the bounds of the fit model.
Each random initial condition is then used in the operation, with the solutions
being populated in the table. If the independently run solutions converge, then
the confidence that the converged solution is correct is increased.
Optimize
Once the desired options have been selected, press the Optimize button.
This could take a significant amount of time to complete, especially if many
attempts are being performed. When finished, the sample and value for each
attempt will be displayed in the table. This table can be sorted by pressing
the column headers.
Plot
The plot tab will show the sampled model and all the optimization attempts in
either 3D or 2D. The plot type can be changed by selecting the plot from the
Plot combo-box. If there are more than two variables, the currently x and y
axis can be changed by selecting the variables from X Axis and Y axis
combo-boxes.
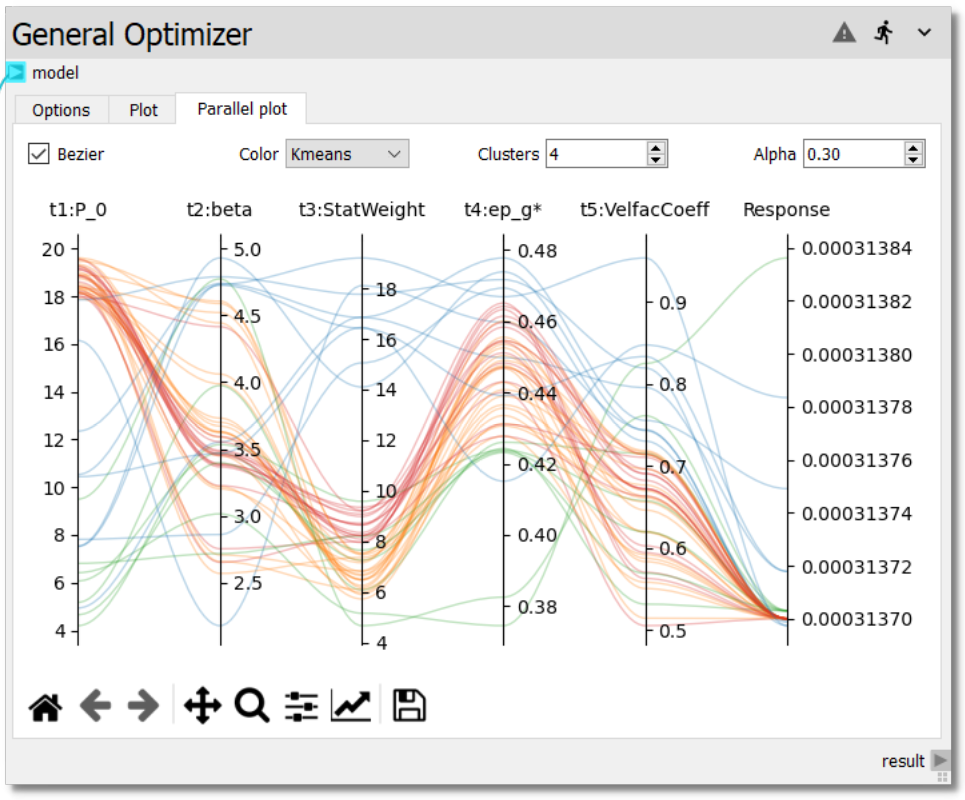
Parallel Plot
Sometimes the optimization routine will find different optimums. To help visualize these optimums and look for groupings of values, the parallel plot plots each optimization attempt. Options across the top provide tools to help visualize the attempts.