4.3. DEM03: Two stacked, compressed particles
This case serves to verify the MFIX-DEM linear spring-dashpot collision model through analysis of a multi-particle, enduring collision. This test case is based on the work of Chen et al. [4] and the MFIX-DEM test case was originally reported in Garg et al. [8].
4.3.1. Description
Two particles of equal radius, \(r_{p}\), are stacked between two fixed walls such that the particles are compressed. The lower and upper walls are located at \(y_{l} = 0.0\) and \(y_{w} = 3.6r_{p}\) and the particle centers are initially located at \(y_{10} = 0.25y_{w}\) and \(y_{20} = 0.75y_{w}\). This configuration, illustrated in Fig. 4.7, ensures that the particles remain in contact and compressed.
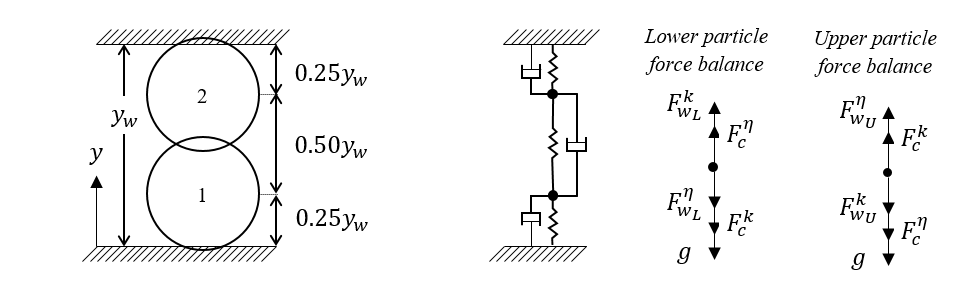
Fig. 4.7 Two smooth spherical particles stacked between two fixed walls so that the system is always under compression. A sketch of the problem mechanics is provided along with force balances for the lower and upper particles.
An expression for the acceleration of the lower particle (particle 1) is
where \(y_{1}\) and \(y_{2}\) are the particle center positions measured from the lower wall, \(g\) is the acceleration due to gravity, \(k_{\text{nw}}\) and \(k_{n12}\) are the particle-wall and particle-particle spring coefficients, \(\eta_{n1w}\) and \(\eta_{n12}\) are the particle-wall and particle-particle damping coefficients, and \(m_{1}\) is the mass of particle 1. Similarly, acceleration of the upper particle (particle 2) is given by
where \(\eta_{n2w}\) is the particle-wall damping coefficient for the upper particle, and \(m_{2}\) is the mass of the upper particle.
4.3.2. Setup
Computational/Physical model |
|||
|---|---|---|---|
1D, Transient |
|||
Granular flow (no gas) |
|||
Gravity |
|||
Thermal energy equation is not solved |
|||
Geometry |
|||
Coordinate system |
Cartesian |
||
x-length |
1.0 |
(m) |
|
y-length |
0.0018 |
(m) |
|
z-length |
0.0010 |
(m) |
|
Solids Properties |
|||
Normal spring coefficient, \(k_{n}\) |
103 |
(N·m-1) |
|
Restitution coefficient, \(e_{n}\) |
varied |
( ) |
|
Friction coefficient, \(\mu\) |
0.0 |
( ) |
|
Solids 1 Type |
DEM |
||
Diameter, \(d_{p}\) |
0.001 |
(m) |
|
Density, \(\rho_{s}\) |
20000 |
(kg·m-3) |
|
Solids 2 Type |
DEM |
||
Diameter, \(d_{p}\) |
0.001 |
(m) |
|
Density, \(\rho_{s}\) |
10000 |
(kg·m-3) |
|
Boundary Conditions |
|||
All boundaries |
Solid walls |
4.3.3. Results
Analytical solutions to equations Eq.4.12 and Eq.4.13 describing the motion of the particles are readily obtainable for perfectly elastic \(\left( \eta_{n12} = \eta_{n1w} = \eta_{n2w} = 1.0 \right)\) particles of equal mass \(\left( m_{1} = m_{2} \right)\). This is not the case for inelastic particles of different mass, therefore a fourth-order Runge-Kutta method is used to calculate a secondary numerical solution which is considered to be the analytical solution during the analysis.
Simulations were conducted for six friction coefficients, [0.5, 0.6, 0.7, 0.8, 0.9, 1.0], using the Adams-Bashforth time-stepping method. Fig. 4.8 shows the motion of the lower (left) and upper (right) particles as well as the absolute value of the relative error for a restitution coefficient of 1. The percent relative difference in results remains below 0.1% for this case. This is the largest observed difference across all cases with the difference in relative error decreasing with decreasing restitution coefficient.
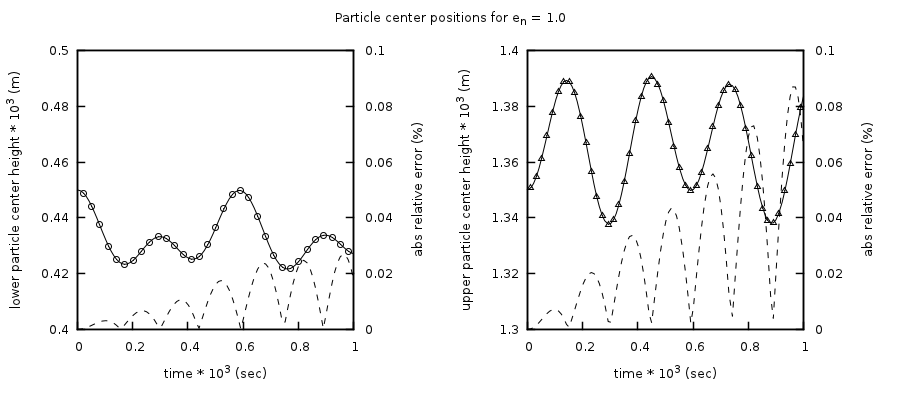
Fig. 4.8 Comparison between the fourth-order Runge-Kutta solution (solid line) and MFIX-DEM simulation (open symbols) for the center position of two stacked particles compressed between fixed walls for a restitution coefficient of 1. The absolute percent relative errors are shown as dashed lines.