4.5. DEM05: Oblique particle collision
This case serves to verify the normal and tangential components of both the linear spring-dashpot and Hertzian collision models in MFIX DEM. This case is based on the modeling work of Di Renzo and Di Maio [20] and utilizes the experimental data of Kharaz, Gorham, and Salman [13].
4.5.1. Description
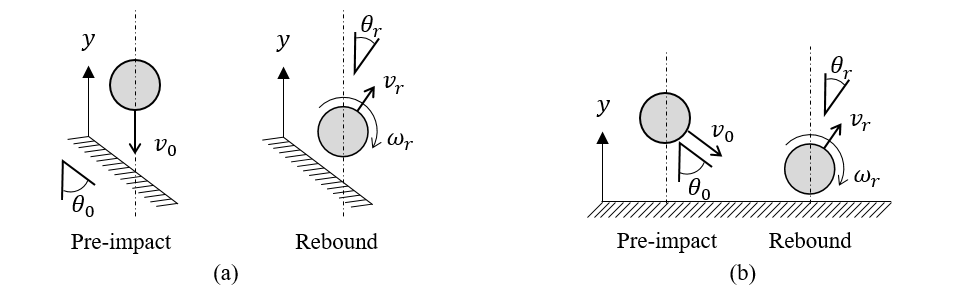
In the experiments of Kharaz, Gorham, and Salman [13], a spherical particle is dropped from a fixed height such that it collides with a rigid surface at a known velocity. The angle of the ridged surface is varied to test impact angles ranging from normal to glancing. The rebound angle, post-collision angular velocity, and observed tangential restitution coefficient were reported.
In the experiment, the particle strikes an angled anvil as illustrated in Fig. 4.11 (a). Rather than modeling an angled surface, the wall is kept level (flat) and the particle is given an initial trajectory corresponding to the angle found in the experiment as shown in Fig. 4.11 (b). The particle is initially positioned close to the wall and gravity is suppressed in the simulations to eliminate the effects of the rotated geometry with respect to the experimental apparatus.
4.5.2. Setup
Computational/Physical model |
|||
|---|---|---|---|
1D, Transient |
|||
Granular flow (no gas) |
|||
Gravity |
|||
Thermal energy equation is not solved |
|||
Geometry |
|||
Coordinate system |
Cartesian |
||
x-length |
0.5 |
(m) |
|
y-length |
0.1 |
(m) |
|
z-length |
0.5 |
(m) |
|
Solids Phase 1 |
DEM |
||
Diameter, \(d_{p}\) |
0.005 |
(m) |
|
Density, \(\rho_{s}\) |
4,000 |
(kg·m-3) |
|
Solids Phase 2 |
DEM |
||
Diameter, \(d_{p}\) |
0.005 |
(m) |
|
Density, \(\rho_{s}\) |
5,000 |
(kg·m-3) |
|
Boundary Conditions |
|||
All boundaries |
Solid walls |
The mechanical properties for the particle (solids phase 1) and the anvil (solids phase 2 and wall) are provided for both the linear spring-dashpot and Hertzian collision models. The second solids phase is given the same properties as the anvil for verification of both the particle-particle and particle-wall collision model implementations.
Linear |
Hertzian |
|
|---|---|---|
Solids Phase 1 |
||
Normal spring coefficient, (N·m-1) |
1.72 x 10⁷ |
– |
Restitution coefficient, (N·m-1) |
1.0 |
– |
Young’s modulus |
380 x 109 |
|
Poisson ratio |
– |
0.23 |
Friction coefficient |
0.092 |
0.092 |
Solids Phase 2 |
Linear |
Hertzian |
Normal spring coefficient, (N·m-1) |
1.72 x 10⁷ |
– |
Restitution coefficient, (N·m-1) |
1.0 |
– |
Young’s modulus |
70 x 109 |
|
Poisson ratio |
– |
0.25 |
Friction coefficient |
0.092 |
0.092 |
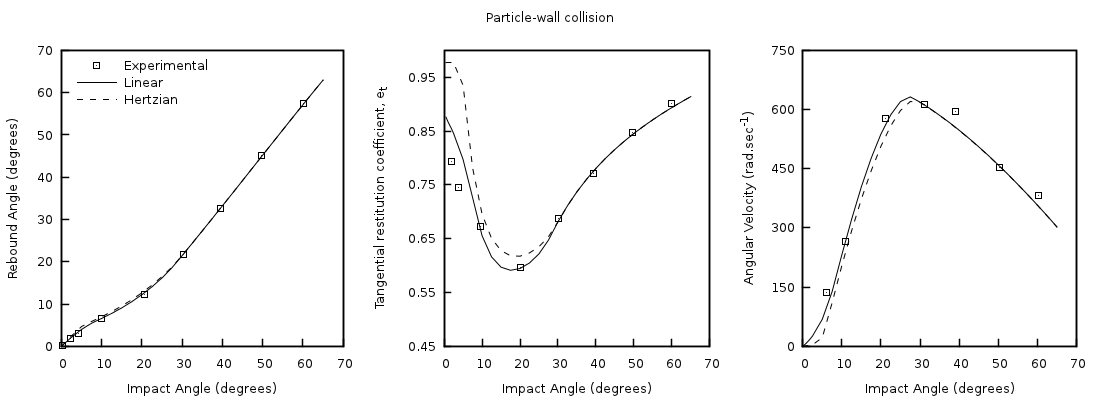
4.5.3. Results
Simulations were conducted using the linear spring-dashpot and Hertzian collision models. Each simulation contained a total of 93 particles. The particle-particle and particle-wall collision models were tested by varying the initial collision angles between 0 (normal) and 65 degrees (glancing). Gravity was suppressed in the simulations to eliminate the effects of the rotated geometry with respect to the experimental apparatus.
The rebound angle, observed tangential restitution coefficient, and post-collision angular velocity for particle-wall collisions are given in Fig. 4.12 with particle-particle collision results shown in Fig. 4.13. There is good agreement between the simulation results and experimental data for the rebound angle and post-collision angular velocity. Although both models over predict the observed tangential coefficient for steep (near-normal) collision angles, better agreement is observed with the linear spring-dashpot model for the parameters used.