
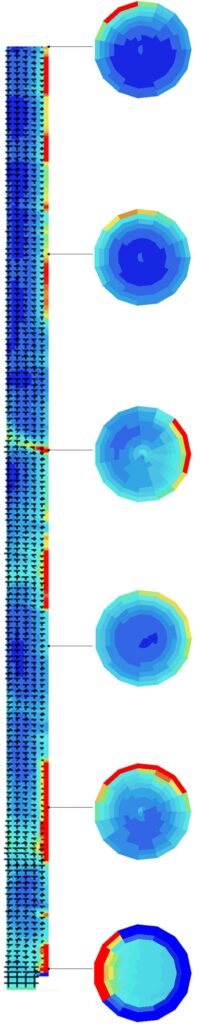
Snapshot of gas volume fraction and velocity vectors in the 3D riser. A vertical cross-section through the riser (not to scale) is shown over half the riser diameter (from centerline to wall). Horizontal cross-sections show the gas volume fraction distribution at every 1.4 m until the top (7 m) of the riser. Red indicates areas with solids volume fraction higher than 2%, and blue indicates dilute regions located mainly at the core of the riser.