5.2. PIC02: Advection in time varying flow field – velocity interpolation
5.2.1. Description
This is a code verification problem discussed in the DEM documentation of Garg et al. [8]. A total of 512 parcels are arranged on a sphere having a radius of 0.15 m centered at (0.35 m, 0.35 m, 0.35 m). The domain under consideration is a unit box (1.0 m X 1.0 m X 1.0 m) discretized uniformly having 32 cells in each direction. A time varying flow-field is prescribed as follows:
5.2.2. Setup
Computational/Physical model |
|||
|---|---|---|---|
3D, Transient |
|||
Multiphase |
|||
Gravity |
|||
Thermal energy equation is not solved |
|||
Turbulence equations are not solved (Laminar) |
|||
Uniform mesh |
|||
First order upqind discritization scheme |
|||
Geometry |
|||
Coordinate system |
Cartesian |
Grid partitions |
|
x-length |
1.0 |
(m) |
32 |
y-length |
1.0 |
(m) |
32 |
z-length |
1.0 |
(m) |
32 |
Material |
|||
Gas density, \(\rho_{g}\) |
1.2 |
(kg·m-3) |
|
Gas viscosity, \(\mu_{g}\) |
1.8E-05 |
(Pa·s) |
|
Solids Type |
PIC |
||
Diameter, \(d_{p}\) |
0.01 |
(m) |
|
Density, \(\rho_{s}\) |
2700 |
(kg·m-3) |
|
Solids Properties (PIC) |
|||
Pressure linear scale factor, \(P_{s}\) |
100.0 |
(Pa) |
|
Exponential scale factor, \(\gamma\) |
3.0 |
(-) |
|
Statistical weight |
1 |
(-) |
|
Initial Conditions |
|||
x-velocity, \(u_{g}\) |
(m·s-1) |
||
y-velocity, \(v_{g}\) |
(m·s-1) |
||
z-velocity, \(w_{g}\) |
(m·s-1) |
||
Gas volume fraction, \(\epsilon_{g}\) |
1.0 |
(-) |
|
Gas volume fraction at packing, \(\epsilon_{g}^{*}\) |
0.4 |
(-) |
|
Pressure, \(P_{g}\) |
101,325 |
(Pa) |
|
Boundary Conditions |
|||
All boundaries are cyclic |
A value of 0.25 is chosen for the time period T and the simulations are run for a total duration of 4 seconds which is equivalent to 16 cycles. The initial parcel configuration and velocities are specified through a particle_input.dat file, typical of MFiX runs that require an exact particle arrangement.
5.2.3. Results
The parcels are sheared in different directions since the center of the spherical arrangement is off from the center of the vortex field. Once the simulation begins, the configuration is deformed and then restored at multiples of time period T as shown in Fig. 5.2. The absolute difference between the exact location and the numerical solution is shown in Table 5.4. The maximum locational error is still within 0.01 m at the end of 16 cycles.
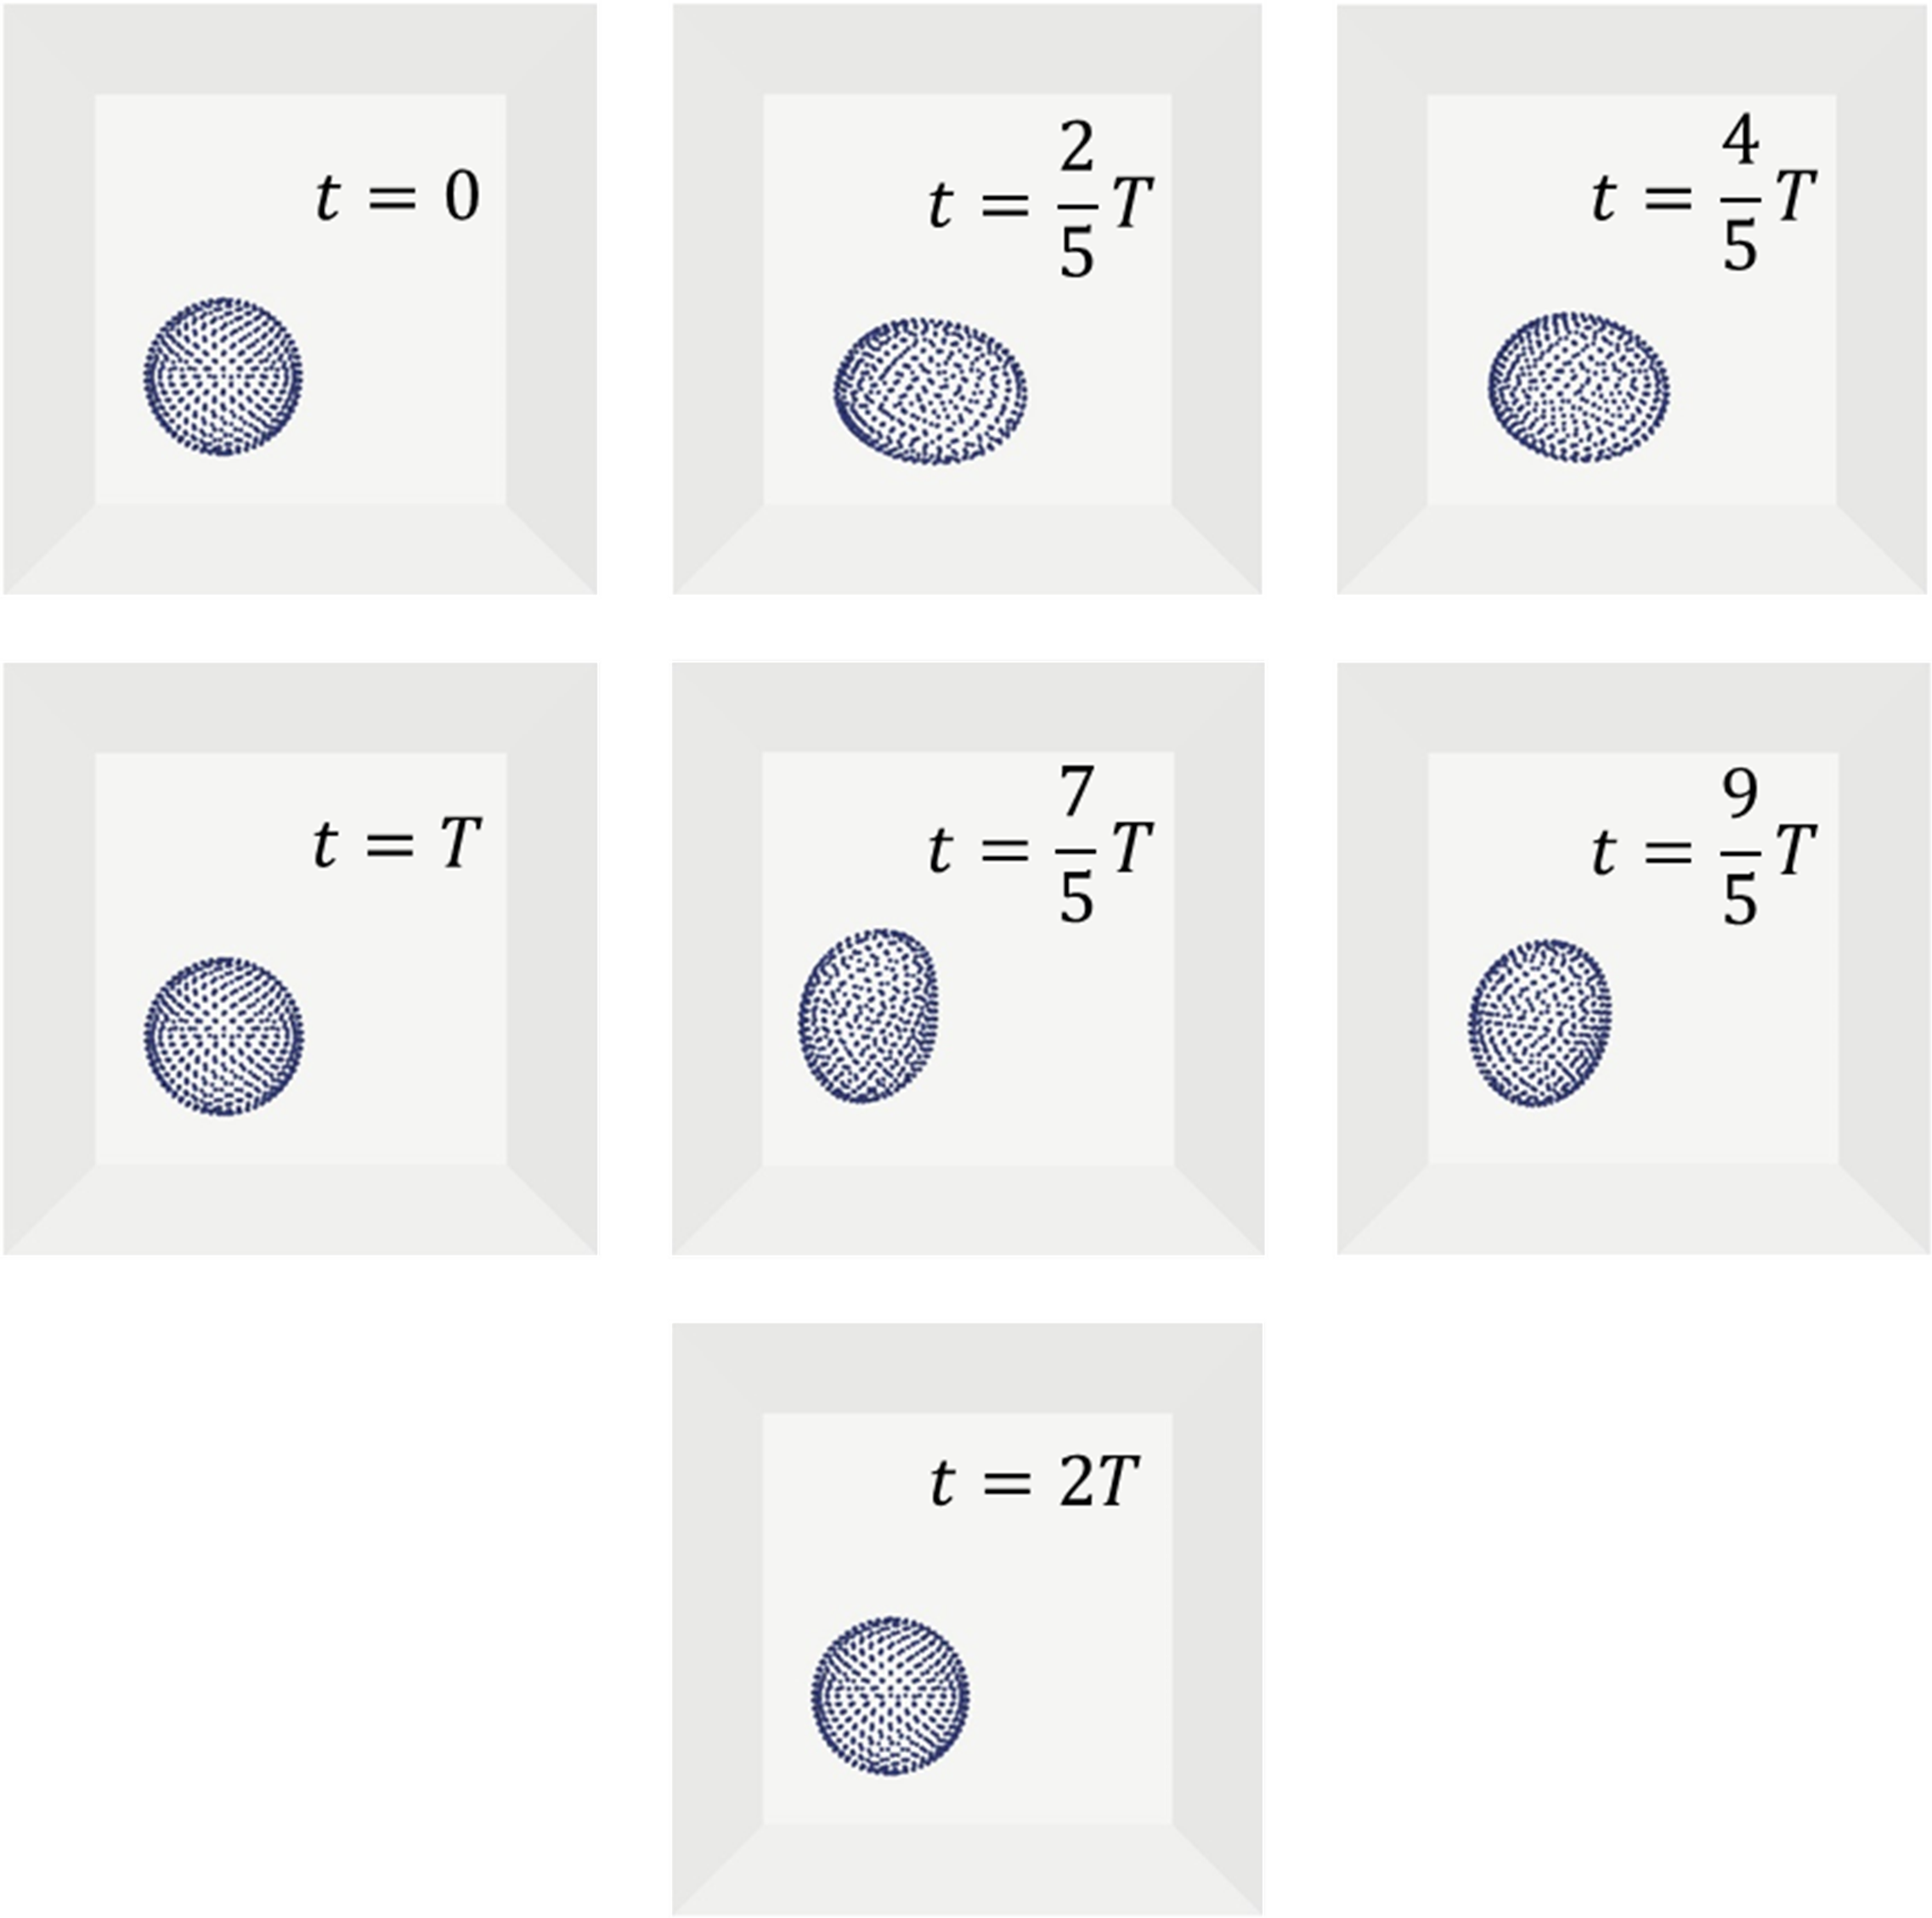
Fig. 5.2 Instantaneous location of parcels for the configuration centered at X=0.35 m, Y=0.35 m, Z=0.35 m. The time stamps are provided inside each snapshot.
Physical Time (s) |
Cycle |
Maximum L1-Norm (m) |
|---|---|---|
0.25 |
1 |
2.11E-03 |
0.50 |
2 |
1.22E-03 |
0.75 |
3 |
2.59E-03 |
1.00 |
4 |
2.44E-03 |
1.25 |
5 |
3.46E-03 |
1.50 |
6 |
3.65E-03 |
1.75 |
7 |
4.49E-03 |
2.00 |
8 |
4.87E-03 |
2.25 |
9 |
5.60E-03 |
2.50 |
10 |
6.08E-03 |
2.75 |
11 |
6.74E-03 |
3.00 |
12 |
7.29E-03 |
3.25 |
13 |
7.90E-03 |
3.50 |
14 |
8.51E-03 |
3.75 |
15 |
9.08E-03 |
4.00 |
16 |
9.72E-03 |